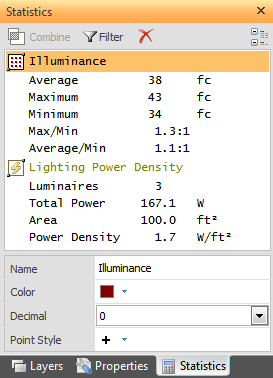
If it is not visible, the Statistics (Sidebar with Statistics tab focus) can be shown by clicking the command on the Windows sub-menu in the Options panel of the Tools tab. Shift+S next to the command indicates that this is the hotkey to initiate the command.

The Statistics tab displays both Calculation Zones and Power Density Zones sorted in alphabetical order by name.
Statistics are displayed for each zone as set in the Settings dialog. See Settings Dialog for more information.
Calculation Zone and Power Density Zone Properties can be modified while the Statistics tab is active in lieu of specifically executing the Properties command. To modify Properties, click the name of a zone. Visual will populate the Properties panel at the bottom of the tab with the parameters for that zone.
Selected zone names are highlighted in yellow in the Statistics tab and additionally the associated zone in the Design Environment is highlighted in red.

Statistics for multiple Calculation Zones and Power Density Zones can be selected and Combined to provide an overall summary. For instance, multiple Power Density Zones could be Combined to provide the Lighting Power Density for an entire building.
Select the desired zones by left-clicking the names in the Sidebar. Select multiple names by holding the Ctrl key or Shift key. Click the Combine button at the top of the Statistics tab. Visual will make a Combined set of Statistics and give it a generic name. Properties for the combined zone can be manipulated like any other zone; i.e. Combined zones can be renamed.

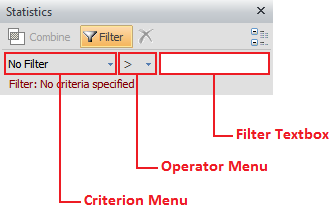
To Filter Calculation Zones and Power Density Zones, click the Filter button to show the Filter panel in the Statistics tab. The small down arrow indicates a menu is available, select from the Criterion Menu, from the Operator Menu, and then enter a value into the Filter Textbox. Visual will show only zones meeting that collective criteria.
Note that selecting a criterion applicable to Calculation Zones (e.g. "Minimum")automatically means Power Density Zones will not be shown and vice versa.
Criteria shown in gray are those not displayed based on system settings in the Settings dialog. See Settings Dialog for more information.
To reset the filter to show all zones, select No Filter from the drop down.

Calculation Zones and Power Density Zones can be Deleted from the Statistics tab by selecting the zones to be Deleted and clicking the Delete button on the tab.

Display of zones can be compacted by pressing the Collapse button in the upper right corner of the Statistics tab. Visual will show only zone names. After the button is pressed it changes to the Expand button and will be highlighted in yellow. Pressing the Expand button reverts to the original state where summary data is shown below the name.

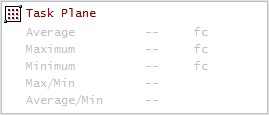
If the Calculation status needs to be updated, Visual displays greyed text and blank numerical entries for the sub entries of Calculation Zones.
Modifications to luminaires (changing to a different type, erasing, changing Wattage in the Luminaire Schedule, etc) will cause Visual to automatically update Power Density Zone Statistics.

Right-clicking a Calculation Zone name initiates a pop-up menu providing Delete, Export, and Properties commands.
Exporting a Calculation Zone is done in CSV format and includes illuminance to five decimal places and the height of each calculation point.
