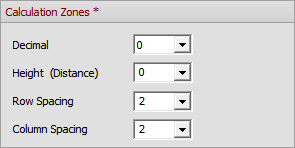
The Calculation Zones panel controls dimensional parameters used in Visual.
Decimal is the number of decimals displayed after the integer value. None, one, or two decimal values can be displayed. Only the options shown in the drop-down are valid.
Height (Distance) is the height offset from the selected coordinates that the plane will be placed. This may be above or below a Surface if Calculation Zones Surface is used to place the Calculation Zone, depending on the direction of the Surface Normal. A selection can be made from the choices in the pull-down or a value can be typed.
Row Spacing is the distance (in feet or meters) between points on the X-axis. A selection can be made form the choices in the pull-down or a value can be typed.
Column Spacing is the distance in (feet or meters) between points on the Y-Axis. A selection can be made from the choices in the pull-down or a value can be typed.

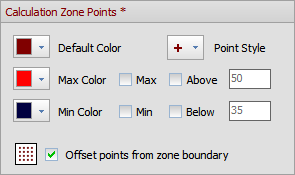
The Calculation Zone Points panel controls the formatting of points and values.
Default Color is the Color that will be assigned to newly created Calculation Zones.
Point Style allows for the selection of a default style for the calculation point marker.
Max Color is that which is assigned to the maximum value in a zone. Unchecking the Max checkbox turns off highlighting. Selecting the Above checkbox means that values above the value in the textbox will be highlighted in the Max Color selection.
Min Color is that which is assigned to the minimum value in a zone. Unchecking the Min checkbox turns off highlighting. Selecting the Below checkbox means that values below the value in the textbox will be highlighted in the Min Color selection.
Offset points from zone boundary means Visual will offset points a certain amount depending on point spacing and Calculation Zone dimensions. This yields a grid of points centered in the selected area. Unchecking the box causes Visual to start placing points in the lower left corner of the selected area based on point spacing as specified in the Calculation Zones panel.
See Using the Color Dialog for more information on Color selection.

The Pseudo-Color Shading panel controls what is displayed in certain modes selected in the Display drop-down from the Rendering panel of the Calculations tab in the Ribbonbar.
Relative will assign the Max Color and Min Color to the highest and lowest values in each Calculation Zone.
Global will assign the Max Color and Min Color to the highest and lowest values in all Calculation Zones in the model.
Selecting the upper Color Preview Bar assigns colors between Max Color and Min Color progressing clockwise around a color wheel. Selecting the lower Color Preview Bar progresses counterclockwise.

Selecting Display Mask Zone Outline will show a dashed line in the Design Environment that indicates where user-selected Masking has been done. This does not impact what is printed in the Print Editor.
Selecting Display Statistical Zone Outline will show a dashed line in the Design Environment that indicates the boundaries of Statistical Zones if present. This does not impact what is printed in the Print Editor.

The Power Density Zones panel controls both the default color and displayed decimal accuracy of Power Density Zones. Valid decimal values are only those provided in the drop-down.

The Statistical Zones panel controls how Visual displays Statistical Zones in the Design Environment.
Default Color is assigned to both the Calculation Points and the associated text value and overrides the base selection of the Calculation Zones.
Point Style overrides the selection made in the base Calculation Zones.

Settings made in subgroups indicated with a "*" and shown in dark red will not change existing objects.
