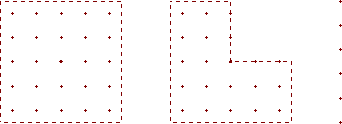
Calculation Zones can be lighting-based (Illuminance, Luminance, etc) or power-based (Lighting Power Density). By default, Visual shows Lighting Calculation Zones in dark red and Lighting Power Density Zones are shown with a olive border and are furthermore shaded.

Lighting Calculation Zones can be defined by rectangular areas, areas bounded by a polygon, or can be locations along a linear path. Calculation Zones can also be placed directly on surfaces (Solid Objects).
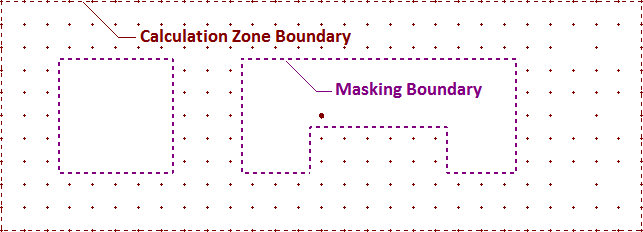
The boundary of the Calculation Zone is indicated by a dashed line and points indicated by crosses are placed in an array defined by the user.
Visual assumes the light meter orientation to be perpendicular to the defining (bounding) plane. This can be modified at creation or by editing Properties after creation.

Lighting Calculation Zones can be modified to remove points that are unwanted using the Masking commands. Points can be Masked with rectangles, polygons, by surface, or individually.
Mask boundaries are shown with a dashed purple line.
The display of the Mask boundary can be turned on or off in the Settings dialog.

Statistical Zones can be created to report information about part of a Lighting Calculation Zone. Statistical Zones are displayed in the Statistics tab of the Sidebar separately from their parent zone.
Statistical Zones can be created with rectangles, polygons, or by selecting surfaces. Statistical Zones can be grouped in the Sidebar for an additional level of reporting and analysis.
Statistical Zone boundaries are shown with a dashed dark green line. Notice how the internal points are omitted by astute boundary selection. Calculation points included in the Statistical Zone have a different symbol.
For example, only the paved area could be shown for a parking lot. Points in the Statistical Zone are indicated with a green asterisk symbol by default.

Lighting Power Density (LPD) Zones can be defined by rectangular areas, areas bounded by a polygon. They have associated luminaires specifically applied to the calculation. LPD Zones can also be placed directly on surfaces (Solid Objects).

When changes have been made to the lighting model that require a re-calculation, Visual will indicate that Calculation Zone values may no longer be valid by bracketing point values.
