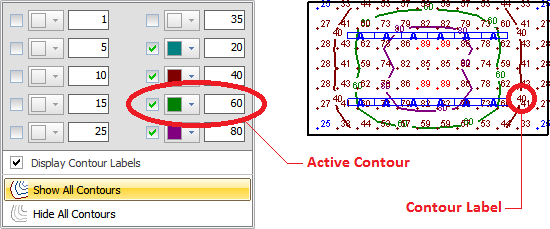
Just as contours on topographical maps show constant elevation, Contours in Visual most often show constant illuminance.
The magnitude of the illuminance (or other metric) is then analogous to elevation on the topographic map.

To show Contours, click the Contours button on the Calculations tab of the Ribbonbar to initiate the sub-menu.

On the sub-menu, place a check in the desired number of contour line checkboxes to activate them.
The Color for each Contour Line can be specified by clicking the Color button.
Once activated, specify the iso-illuminance value in each textbox.
Select Show All Contours to turn the feature on.
Conversely, select Hide All Contours to turn the feature off.

The display of Contour Labels can be toggled in the Contours sub-menu as shown above. This can also be toggled in the Settings dialog.
Contour Label increment is set on the Contours tab of the Settings dialog and uses the base drawing units. For example, "20" implies each label will be placed nominally 20 feet or meters apart.

Contours can be displayed in a Shaded fashion (with pseudocolor) by editing Properties for a Calculation Zone and placing a check in the Shaded box in the Properties tab.
The method used to Shade is that chosen in the Calculation Zones Settings.

Note that the display of Calculation Points can be toggled in Properties as well. This is likely useful when displaying a Calculation Zone with Shading as discussed above but depends on user preference.
